Figure 4
Evolutive immunologic and toxicologic approach in some neuroinflammatory and degenerative disease like SM, DA, PD: Imaging and Brain Wasting System clearance efficacy
Mauro Luisetto*, Akram Muhamad, G Ibrahim, Behzad Nili Ahmadabadi, Farhan Ahmad Khan, Ahmed Yesvi Rafa and Oleg yurevich latyshev
Published: 30 April, 2020 | Volume 4 - Issue 1 | Pages: 005-013

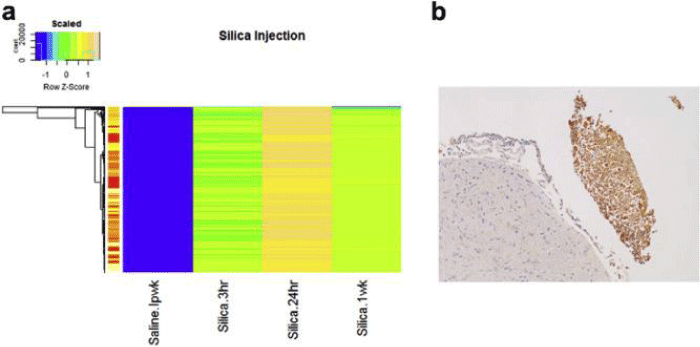
Figure 4:
Heatmap of LIBS spectrum results from simulated silicon probe insertion and isolated immune response. a) Heatmap differentiating control (saline group), and silicon- groups (3hrs, 24hrs, and 1 wk). The scaled difference is -1 to 1 with silicon 24hr being most different from the control. The immune response at 24hr likely contributed to the greatest difference in the spectra. b) Isolated immune- response was found by IHC macrophage staining of CD68 (AB31630). Note the response was isolated and near the inferior- colliculus injection site, but located exterior to the needle -mark.
Read Full Article HTML DOI: 10.29328/journal.icci.1001014 Cite this Article Read Full Article PDF
More Images
Similar Articles
-
Evolutive immunologic and toxicologic approach in some neuroinflammatory and degenerative disease like SM, DA, PD: Imaging and Brain Wasting System clearance efficacyMauro Luisetto*,Akram Muhamad,G Ibrahim,Behzad Nili Ahmadabadi,Farhan Ahmad Khan,Ahmed Yesvi Rafa,Oleg yurevich latyshev. Evolutive immunologic and toxicologic approach in some neuroinflammatory and degenerative disease like SM, DA, PD: Imaging and Brain Wasting System clearance efficacy. . 2020 doi: 10.29328/journal.icci.1001014; 4: 005-013
Recently Viewed
-
Advancing Forensic Approaches to Human Trafficking: The Role of Dental IdentificationAiswarya GR*. Advancing Forensic Approaches to Human Trafficking: The Role of Dental Identification. J Forensic Sci Res. 2025: doi: 10.29328/journal.jfsr.1001076; 9: 025-028
-
Scientific Analysis of Eucharistic Miracles: Importance of a Standardization in EvaluationKelly Kearse*,Frank Ligaj. Scientific Analysis of Eucharistic Miracles: Importance of a Standardization in Evaluation. J Forensic Sci Res. 2024: doi: 10.29328/journal.jfsr.1001068; 8: 078-088
-
Sinonasal Myxoma Extending into the Orbit in a 4-Year Old: A Case PresentationJulian A Purrinos*, Ramzi Younis. Sinonasal Myxoma Extending into the Orbit in a 4-Year Old: A Case Presentation. Arch Case Rep. 2024: doi: 10.29328/journal.acr.1001099; 8: 075-077
-
Toxicity and Phytochemical Analysis of Five Medicinal PlantsJohnson-Ajinwo Okiemute Rosa*, Nyodee, Dummene Godwin. Toxicity and Phytochemical Analysis of Five Medicinal Plants. Arch Pharm Pharma Sci. 2024: doi: 10.29328/journal.apps.1001054; 8: 029-040
-
Antibacterial Screening of Lippia origanoides Essential Oil on Gram-negative BacteriaRodrigo Marcelino Zacarias de Andrade, Bernardina de Paixão Santos, Roberson Matteus Fernandes Silva, Mateus Gonçalves Silva*, Igor de Sousa Oliveira, Sávio Benvindo Ferreira, Rafaelle Cavalcante Lira. Antibacterial Screening of Lippia origanoides Essential Oil on Gram-negative Bacteria. Arch Pharm Pharma Sci. 2024: doi: 10.29328/journal.apps.1001053; 8: 024-028.
Most Viewed
-
Evaluation of Biostimulants Based on Recovered Protein Hydrolysates from Animal By-products as Plant Growth EnhancersH Pérez-Aguilar*, M Lacruz-Asaro, F Arán-Ais. Evaluation of Biostimulants Based on Recovered Protein Hydrolysates from Animal By-products as Plant Growth Enhancers. J Plant Sci Phytopathol. 2023 doi: 10.29328/journal.jpsp.1001104; 7: 042-047
-
Sinonasal Myxoma Extending into the Orbit in a 4-Year Old: A Case PresentationJulian A Purrinos*, Ramzi Younis. Sinonasal Myxoma Extending into the Orbit in a 4-Year Old: A Case Presentation. Arch Case Rep. 2024 doi: 10.29328/journal.acr.1001099; 8: 075-077
-
Feasibility study of magnetic sensing for detecting single-neuron action potentialsDenis Tonini,Kai Wu,Renata Saha,Jian-Ping Wang*. Feasibility study of magnetic sensing for detecting single-neuron action potentials. Ann Biomed Sci Eng. 2022 doi: 10.29328/journal.abse.1001018; 6: 019-029
-
Pediatric Dysgerminoma: Unveiling a Rare Ovarian TumorFaten Limaiem*, Khalil Saffar, Ahmed Halouani. Pediatric Dysgerminoma: Unveiling a Rare Ovarian Tumor. Arch Case Rep. 2024 doi: 10.29328/journal.acr.1001087; 8: 010-013
-
Physical activity can change the physiological and psychological circumstances during COVID-19 pandemic: A narrative reviewKhashayar Maroufi*. Physical activity can change the physiological and psychological circumstances during COVID-19 pandemic: A narrative review. J Sports Med Ther. 2021 doi: 10.29328/journal.jsmt.1001051; 6: 001-007

HSPI: We're glad you're here. Please click "create a new Query" if you are a new visitor to our website and need further information from us.
If you are already a member of our network and need to keep track of any developments regarding a question you have already submitted, click "take me to my Query."


